Plotly Fundamentals -
Animations
Coming soon …
import pandas as pd
import plotly.express as px
import plotly.graph_objects as goComing soon …
df = px.data.gapminder()
fig= px.scatter(df, x="gdpPercap", y="lifeExp", animation_frame="year", animation_group="country",
           size="pop", color="continent", hover_name="country",
           log_x=True, size_max=55, range_x=[100,100000], range_y=[25,90], height=800)
fig.show()Coming soon …
fig = px.bar(df, x="continent", y="pop", color="continent",
  animation_frame="year", animation_group="country", range_y=[0,4000000000], height=800)
fig.show()Coming soon …
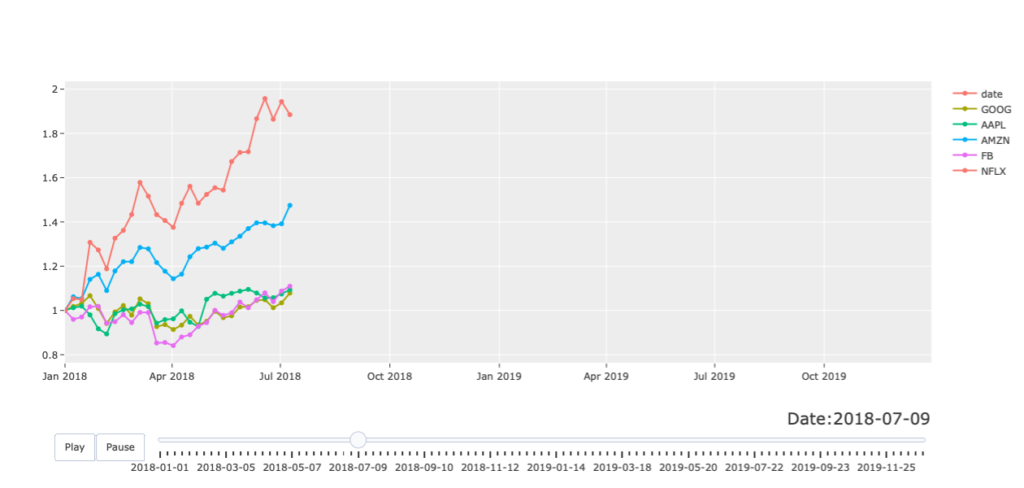
stocks = px.data.stocks()
stocks.head()| date | GOOG | AAPL | AMZN | FB | NFLX | MSFT | |
|---|---|---|---|---|---|---|---|
| 0 | 2018-01-01 | 1.000000 | 1.000000 | 1.000000 | 1.000000 | 1.000000 | 1.000000 |
| 1 | 2018-01-08 | 1.018172 | 1.011943 | 1.061881 | 0.959968 | 1.053526 | 1.015988 |
| 2 | 2018-01-15 | 1.032008 | 1.019771 | 1.053240 | 0.970243 | 1.049860 | 1.020524 |
| 3 | 2018-01-22 | 1.066783 | 0.980057 | 1.140676 | 1.016858 | 1.307681 | 1.066561 |
| 4 | 2018-01-29 | 1.008773 | 0.917143 | 1.163374 | 1.018357 | 1.273537 | 1.040708 |
Coming soon …
dates = list(stocks['date'].unique())
stock_names = list(stocks.columns[1:])

#create empty figure
fig = go.Figure()


#prepare figure function input as python dictionary

fig_dict = {
    "data": [],
    "layout": {},
    "frames": []
}


fig_dict["layout"]["updatemenus"] = [
    {
        "buttons": [
            {
                "args": [None, {"frame": {"duration": 100, "redraw": False},
                                "fromcurrent": True, "transition": {"duration": 100,
                                                                    "easing": "elastic"}}],
                "label": "Play",
                "method": "animate"
            },
            {
                "args": [[None], {"frame": {"duration": 0, "redraw": False}, #hack to drop animation
                                  "mode": "immediate",
                                  "transition": {"duration": 0}}],
                "label": "Pause",
                "method": "animate"
            }
        ],
        "direction": "left",
        "pad": {"r": 10, "t": 87},
        "showactive": False,
        "type": "buttons",
        "x": 0.1,
        "xanchor": "right",
        "y": 0,
        "yanchor": "top"
    }
]


#perpare slider dictionary

sliders_dict = {
    "active": 0,
    "yanchor": "top",
    "xanchor": "left",
    "currentvalue": {
        "font": {"size": 20},
        "prefix": "Date:",
        "visible": True,
        "xanchor": "right"
    },
    "transition": {"duration": 100, "easing": "elastic"},
    "pad": {"b": 10, "t": 50},
    "len": 0.9,
    "x": 0.1,
    "y": 0,
    "steps": []
}


#create one trace for each stock that only shows first data point for first date (Initital Value)

for stock in stock_names:
    data_dict = {
        "x": dates,
        "y": stocks[stock][stocks['date']==dates[0]],
        'name':stock,
        'mode': 'lines+markers'
        }
    fig_dict["data"].append(data_dict)


#loop through each date and add successively one data point for each stock and save in frame

for date in dates:
    frame = {"data": [], "name": str(date)} #frame is same plot as initial value (one per date)
    for stock in stocks:
        data_dict = {
        "x": dates,
        "y": stocks[stock][stocks['date']<=date],
        'name':stock,
        'mode': 'lines+markers'
        }
        frame["data"].append(data_dict) #one trace per date per stock


#for each date save frame in fig dictionary and create slider step

    fig_dict["frames"].append(frame)
    slider_step = {"args": [
        [date],
        {"frame": {"duration": 100, "redraw": False},
         "mode": "immediate",
         "transition": {"duration": 100, 'easing': 'elastic'}}
    ],
        "label": date,
        "method": "animate"}
    sliders_dict["steps"].append(slider_step)

fig_dict["layout"]["sliders"] = [sliders_dict]


fig = go.Figure(fig_dict)
fig.update_layout(xaxis_range =[dates[0], dates[-1]], height = 600)
fig.show()
